Portfolio Managers’ #1 Frustration With Equity Research Analysts

While I was studying the Japanese language during college, I initially didn’t take notice that the word “chigau” (ちがう) is used to convey both “different” and “wrong.” But after moving to Tokyo and learning the importance of conforming to the group, I developed a newfound appreciation for why these two English words require only one in Japanese.
I wish we had a word in English that could be used to convey both “different” as well as “correct”, because we could use it with equity research analysts to reinforce that great stock calls are those that are differentiated. After interviewing portfolio managers in New York, London, Tokyo and Singapore, I discovered one common complaint…buy-side and sell-side analysts aren’t differentiated enough from consensus. The PM’s #1 issue is they often can’t see how their internal analysts or sell-side analysts clearly differ from consensus expectations.
I’m not suggesting be different simply to be different, but don’t expect a PM to find value in ideas closely aligned with consensus
So ask yourself, for your past 3-4 stock calls, how did you differ from consensus? I’m sure you’ll come up with answers that put you at ease, but push yourself hard to see if you were really that different. To test yourself, use the framework below, which I developed to help analysts ensure their calls are genuinely differentiated.
A basic ingredient to a great stock call starts with an out-of-consensus price target (e.g. one that differs at least 20% from the current stock price), which is simply the product of the analyst’s financial forecast multiplied by a valuation multiple. Start with these two elements which might look like this in a report or presentation…”For my upgrade of McDonald’s (MCD), I apply the stock’s current 16.2x multiple to my 2016 EPS estimate of $6.40 for a price target of $104 one year from now, which is 15% above yesterday’s close.” Then determine how much each of the two numbers differ from consensus.
How Do You Differ?
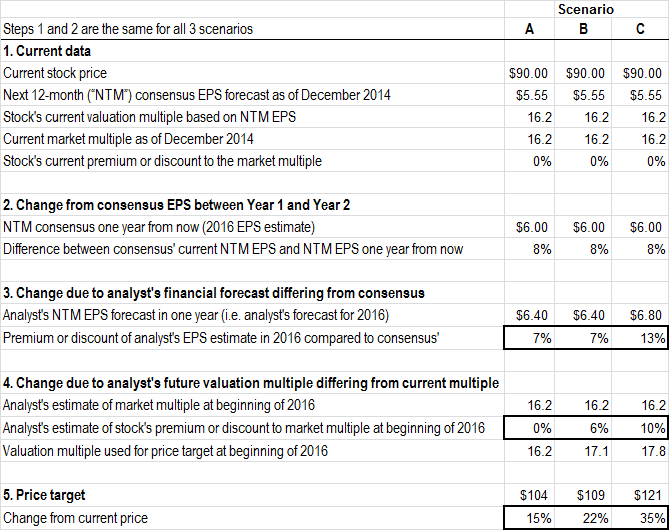
Scenario A
Starting with the EPS estimate, even though the analyst’s $6.40 for 2016 is a whopping 29% higher than the $4.95 MCD is expected to earn for full year 2014, it’s only 7% above the consensus 2016 estimate of $6.00, and so he can take credit for just that $0.40, or the last 7% upside. Before you reject this thesis, ask yourself why can’t the PM just apply the current 16.2x multiple on the $6.00 consensus EPS for 2016 and eliminate the need to have an analyst? They can, and that’s why the analysts should only take victory laps for areas where they differ from consensus.
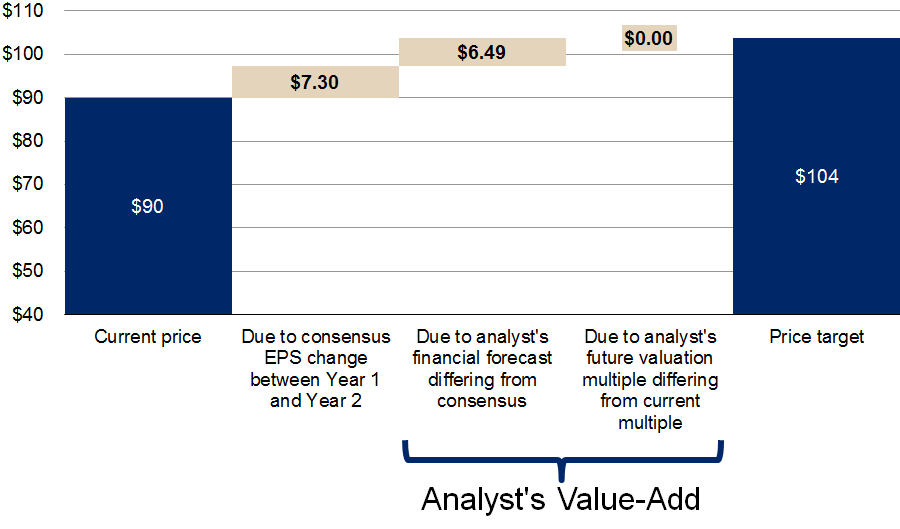
The waterfall chart below for Scenario A, illustrates that the stock’s movement from its current $90 to the analyst’s $104 price target is comprised of $7.30 simply due to the consensus EPS growth (16.2x multiple x incremental $0.45 EPS in 2016 vs. 2015) and $6.49 resulting from the analyst’s unique “value add” (16.2x multiple x the extra $0.40 in the analyst’s estimate of $6.40 vs. consensus at $6.00).
Scenario B
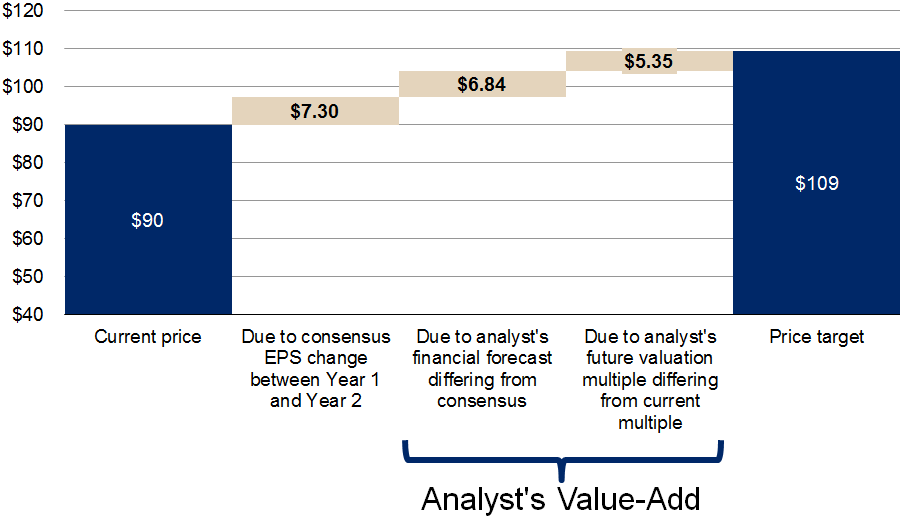
Moving onto the other half of the equation, the valuation multiple: if the 16.2x P/E multiple used for the one-year target is the same as present, then the analyst is using the consensus thought process, which isn’t necessarily bad in terms of an appropriate valuation multiple, but don’t give him credit for adding value as far as the PM is concerned (or client if on the sell-side). An analyst may try to add value by using an out-of-consensus valuation multiple for the price target, but too often there’s no justification for this and it’s essentially just a form of reverse engineering. To say the price target has been raised from the $104 in the example above up to $109 (which is based on applying a 17x multiple on the analyst’s $6.40 EPS) often has no basis other than the analyst wishes for the multiple to expand. Multiples tend to expand relative to the market only when earnings growth is accelerating, which is not that common other than when recovering from an economic slowdown.
This “valuation-juiced” price target is shown as Scenario B in the waterfall chart below, where the $6.49 in the Scenario A waterfall chart increases to $6.84, thanks to a higher multiple (17x vs. 16.2) on the analyst’s incrementally higher EPS estimate ($0.40 above consensus) as well as a new element, $5.35 added to the price target for applying the 17x multiple to the consensus estimate of $6.00.
I’m not suggesting be different simply to be different, but be careful about giving yourself credit for recommending a stock based on an idea that’s closely aligned with consensus. If it’s already in consensus, how are you serving your PM or clients who are paying you to develop out-of-consensus insights?
Scenario C
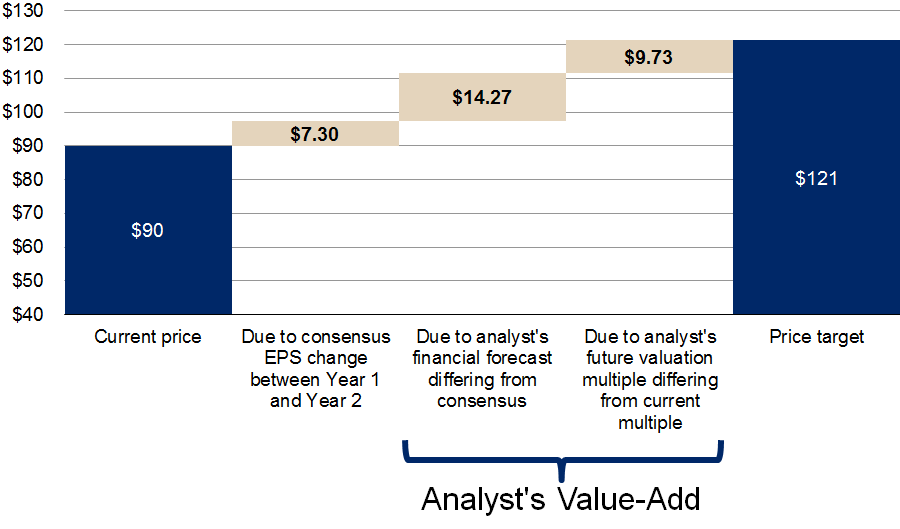
As shown in the waterfall chart below, in Scenario C, the analyst’s genuinely out-of-consensus assumptions for both EPS (13% above consensus) and valuation multiple (10% above consensus), results in $24 of the $31 upside in the stock. If the analyst has done the research to back these assumptions, it’s an example of a call that’s far from “chigau” because it’s different, which in the eyes of the PM is a requirement for being correct.
This Best Practices Bulletin™ targets the FaVeS™ framework which is discussed in further detail on pages 274-286 of Best Practices for Equity Research Analysts.
Visit our Resource Center to find more helpful articles, reference cards, and advice towards your growth as an Equity Research Analyst.
©AnalystSolutions LLP All rights reserved. James J. Valentine, CFA is author of Best Practices for Equity Research Analysts, founder of AnalystSolutions and was a top-ranked equity research analyst for ten consecutive years