Lacking Unique Stock Insights? Find and Focus Only on Critical Factors (Part 3 of 3)

In Part 1 & Part 2 of this series, I asked if you have trouble finding time to develop killer insights for stock picking.
To solve this dilemma, I provided a relatively simple concept that I’ve taught hundreds of highly-successful buy-side and sell-side equity research analysts, specifically to identify and monitor a stock’s critical factors.
Analysts create 1-5 hours of extra alpha-generating research time per day after implementing these four key steps
If you follow this framework you’ll have more time for generating unique insights, model your companies better, be a better stock picker and communicate your stock calls more effectively. In this installment I’ll focus on how to create a list of critical factors for each of your stocks, which is based on this framework below:
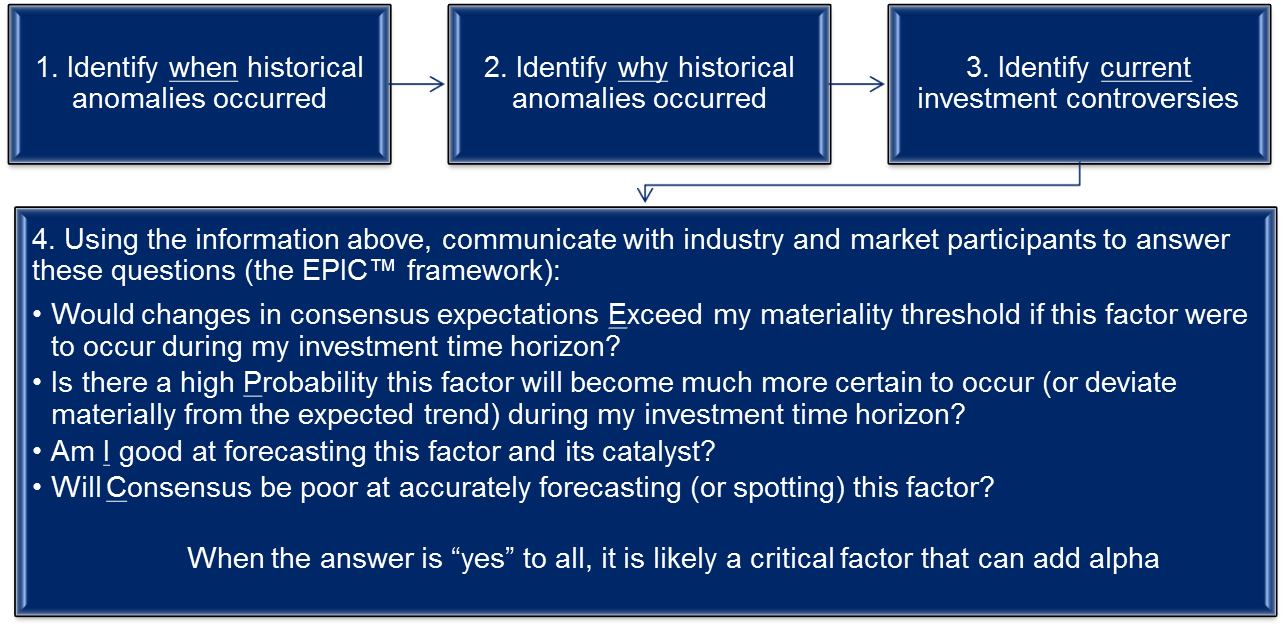
Follow these four steps to identify critical factors
Do you agree with this statement: “Most of the factors that drive stock prices in the current market place are not similar to factors in the past.”? From over 2,000 analysts who responded to our survey, we found experienced analysts disagreed with this statement more often than inexperienced analysts. Put another way, experienced analysts know history tends to repeat itself.
And yet, so many analysts, especially the inexperienced, operate under the guise their sector(s) was formed no more than a year earlier than when they picked it up. There is so much to learn by reviewing the history of a stock, but it can be a tedious exercise that consumes time most analysts don’t have, especially if it’s not done in an intensely-focused manner. We’ve found that those analysts who follow this process and identify the critical factors for their stocks reap the long-term benefits in terms of generating additional research time and more unique insights.
With this in mind, let’s first divide all factors that move stocks into two categories: those that can recur (such as a price war breaking out in an industry), and those that don’t (such as when Apple rolled out its first iPod or debuted iTunes).
This is where we start with Step 1 of our framework. Set up a template in your market data account (Bloomberg, FactSet, etc.) that makes it easy to see when a given stock significantly out- or under-performed relative to a) it’s sector; and b) a broad index. Depending on the amount of time you can dedicate to this process, find at least 3 and as many as 8 time periods that contain these anomalies.
In Step 2, review the company’s regulatory filings, news reports and sell-side reports to determine the cause of the anomalous performance. The goal here is to add as many historical drivers and catalysts to a list of factors (note I didn’t say “critical factors” yet because we’ll rank those that are critical later). After this step, you should hopefully have at least 5 factors on your list and possibly as many as 15.
In Step 3, we fast forward to the future by reviewing only the most recent versions of the items below. As you review them, add to your list any investment controversies or opportunities that look like they could be a factor to move the stock materially in the future:
- The MD&A and risks section of the company’s most recent regulatory filing
- Transcript and related material from the most recent company presentation
- Most recent trade journal or industry blog posting
- Notes from colleague(s) who has participated in recent company calls and meetings
- Most recent sell-side reports (for buy-side analysts)
The last step is to go through your list (which will hopefully be 10-25 items long) and rate each on these four metrics below (from the EPIC™ framework in Part 2 of this series) on a scale of 1 to 5, with 5 as strongly agree:
- Will changes in consensus Expectations exceed my materiality threshold if this factor were to occur during my investment time horizon?
- Is there a high Probability this factor will become much more certain to occur, or deviate materially from the consensus trend, during my investment time horizon?
- Based on my research on the topic, am I good at forecasting this factor and its catalyst? (it’s not just a guess)
- Based on the information in the current market, is the overall Consensus poor at accurately forecasting or spotting changes in this factor?
Add up the scores for each factor. You may want to put more weight on #1 and #2 because they often have more significance than #3 and #4.
The factors with the highest total score should be at the top of your list, namely they are places where you should spend your time identifying insights not found in consensus. You may not be surprised by the 1 to 4 that rise to the top of your list. But here’s the killer element of this productivity tool…ignore everything else on the list! When you’re asked to attend a conference call, meeting or take a phone call on any factors not among the top 4, resist the temptation and focus instead on the top 4 (which we define as the true “critical” factors). Don’t proactively have conversations, make presentations or write reports on any non-critical factors because it’s a waste of time that could otherwise be spent on critical factors. I find the best analysts stay disciplined in only focusing on critical factors.
I challenge you to go through your calendar for the past week and see how much time you spent on items that will not merit a “strongly agree” to most or all of the four questions above.
Keep in mind there are 2 downsides to our framework above:
- It takes time. But recall, like so many things in life, if it were easy everyone would be doing it. More importantly, once you’ve made the investment (3-10 hours per stock in your universe), you’ll reap the dividends by adding 1-5 extra hours per day to your productivity that’s currently being cluttered focusing on non-critical factors.
- You won’t know everything about all of your stocks (you’ll become a stock analyst rather than a company or industry analyst). When a portfolio manager asks “why did McDonald’s drop the McRib from its menu?” Don’t feel bad for not knowing and instead know that you’re focused on the factors that are most likely to generate alpha (is MCD going to massively out- or under-perform due to the McRib?). Politely say “I can look into that, but based on my work, it’s not a critical factor because…(fill in the blank based on which of the four questions above are not answered ‘strongly agree’).”
There’s one more important part of the process and that’s “monitoring” for new critical factors. As you come across new information, quickly put it through the four questions above. If you can’t answer question #1, you need to decide how much time to dedicate to the issue, but only to get an estimate of materiality. Most of the time you’ll discover it doesn’t meet your threshold and you won’t need to answer any of the other questions. Here’s a flow chart that diagrams the process.
This link will allow you to open an Excel spreadsheet that summarizes the process to use with your stocks:
AnalystSolutions provides equity research training with a specialized workshop to help Identify & Monitor a Stock’s Critical Factors.
This Best Practices Bulletin™ covers the following elements of our GAMMA PI™ framework:
#1. Generate Informed Insights
#2. Accurately Forecast
#3. Make Accurate Stock Recommendations
#4. Motivate Others to Act
Visit our new Resource Center to find more helpful articles, reference cards, and advice towards your growth as an Equity Research Analyst.
©2014 AnalystSolutions LLP All rights reserved. James J. Valentine, CFA is author of Best Practices for Equity Research Analysts, founder of AnalystSolutions and previous top-ranked equity research analyst